Using A Spreadsheet To Build A Google Earth Visualization
Google Earth (GE) is one of the easiest tools to build geospatial presentations. I have used GE for situational awareness, analysis, and for briefing. While there a number of tools available to build visualization, I have found using a spreadsheet offer the highest degree of flexibility.
Overview
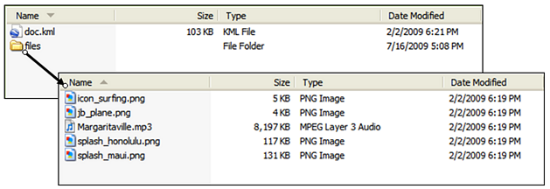
Developing a visualization for Google Earth requires the analyst understand how to use the Keyhole Markup Language (KML). There are two basic type of files used to store code for GE: the KML file and the KMZ file. A KML file is the simplest form of GE documents. A KML can include placemarks, ground overlays, paths, and polygons. They can be authored directly in Google Earth or in a text editor then opened in GE.
The KMZ file is similar to a KML except it is saved in a zip format. A KMZ file consists of a main KML file and one or more supporting files packaged using a Zip utility into one unit, called an archive. The KMZ file can then be stored and emailed as a single entity. A NetworkLink can fetch a KMZ file from a web server. When the KMZ file is unzipped, the main .kml file and its supporting files are separated into their original formats and directory structure and extensions. In addition to being an archive format, compressed as a single large KML file. This process results in 10:1 compression.
Concept
Developing a KML file from a spreadsheet provides some very specific advantages: allows internal analysis, filtering, sorting, but most of, it allows a method for ingesting data and forming it into useful geo-visualizations. For this demonstration we will be using data from the United Nations World Heritage Convention. This data set contains 1,032 sites of different categories and types. Our objective is to identify only those sites that have cultural significance that are in danger of being lost. While the UN publish a kmz file, our objective is to make a GE visualization using a spreadsheet alone.
Step 1: Evaluate
The evaluation step is crucial to the design and implementation of the spreadsheet. The analyst must ask the question about what is the objective of the visualization. The analyst ust determine if the dataset to be used has the necessary data to support the visualization. The data must be compiled, sorted, and filtered to reflect the nature of the analytical project.
In this case, I have selected the following fields to use: id_no, name_en, short_description_en, justification_en, longitude, latitude, and states_name_en. I then filtered by the category: cultural, which resulted in 802 records. I then wanted to display only those records that were on the World Heritage Convention Danger List. I filtered the danger_list so that only those records that inscribed the date of its Danger List inclusion, which resulted in 32 records.
While there a number of fields that are of no use to the visualization, there is no need to hide or remove these fields as they will be addressed in the coding step.
Step 2: Coding
The next step is to develop the coding for each placemark. By selecting all fields of the spreadsheet and creating them as an Excel table. The table format allows for easy filtering and sorting as well as an easy way to replicate KML coding across each record.
It is important to understand that each record forms a placemark, line, or polygon only. While other elements such as images, links, and overlays can be added, for this example, we will only use a simple placemark.
At this point, the analyst must develop an understanding of how they want to display data inside the placemark balloon. This will set the requirements for the KML annotation pattern. We add an additional field at the end of the table and label in "kml". Using the KML Reference as a guide I then build the code for the placemark using the CONCATENATE formula. Once the coding has been accomplished, open a Notepad application and add the namespace for KML,
Step 3: Testing
We have formed the placemarks that will be rendered in GE through this process. Open a text editing program such as "Notepad". You will want to save the file as a kml.
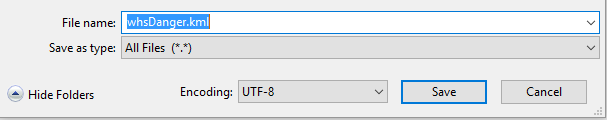
Before we can finalize our kml file, we need to add a few other components.
Once added, place the placemark code into the document and save. Now we can test the file. It can be opened inside Google Earth or double-clicked to open. Normally, you will need to update code to visualize what you want. You can also add images, video, or anything else. The use of a spreadsheet increases the ability of the analyst to present information in a shorter period of time. Try a few experiments for yourself!